Google Analytics is a web analytics source that tracks and reports traffic to help marketers understand their customers in a more complete way. Learn how to make the most of this tool with these tips and hacks.
On a superficial level, Google Analytics is helpful to marketing professionals because it provides insight into: How many people are visiting your page? What are they doing while they live there? And how long do they last?
Google Analytics Real-time Reports
In real-time reports, you can see how many visitors your site has, what pages they’re visiting, what social platforms they’re coming from, where they’re located, and more.
Google Analytics audience report
Check out this report once a day to get an idea of how you’re trending.
Below “Overview,” you’ll find expandable menus for “Audience” as well as “Demographics,” “Interests,” “Live,” “Behavior,” “Technology,” “Mobile,” “Cross-device,” ” will appear. Custom,” and “Benchmarking.”
Explore each of these sections to understand what they can tell you about your visitors. Each segment describes an audience.
Google Analytics lifetime value report
Use this report to see how customers behave when you launch a specific social campaign or send out marketing promotions to engage customers.
Google Analytics acquisition report
Acquisition reports segment your traffic by source: Organic, Direct, Referral, Email, Social, Paid Search, Performance, Engagement, and (Other). (GA uses the (other) category when it doesn’t know how to classify a subset of traffic.)
Google Analytics Behavior Report
Behavior overview reports focus on individual pages of your website as opposed to the entire site. You can also review how content is performing by page URL, title, search term, or event.
Google Analytics Conversions Report
Conversion reports are arguably the most useful reports for most businesses. These reports will help you to know about how well your site performs.
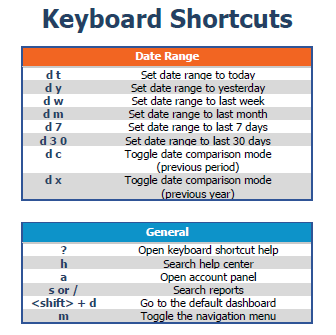
Keyboard Shortcuts
Most people don’t even know they exist, but keyboard shortcuts help you get things done a lot faster.
When on your dashboard, “?” Keys on your keyboard to pull up the shortcut list:
Although it may take you a few hours of practice to get familiar with the shortcuts, they can be a great time saver when creating and editing new reports.
Delete your IP address
Have you ever tried to check your website to make sure everything is correct and then noticed that your business IP address is showing up in your Google Analytics data?
Not only is this annoying, but it can also skew your reporting a bit.
What’s worse is if your office has an entire team working on different parts of the website, and each of those hits are accounted for within your metric. Oh!
Review reports regularly
Review your key KPIs weekly and do a thorough review of your reports at least once a month. Also, review the performance of your website immediately after any major updates to check that performance has not been negatively affected or has improved.
Compare past performance
When reviewing reports, you always want to compare them with historical data. Specifically, you want to see positive changes in key areas over time.
KPIs won’t reveal much without comparing your current results to historical values. This comparison is especially important when implementing reforms. Ultimately, the only way to assess what works and what doesn’t is by comparing the results before and after any revisions.
Final Thoughts
Google Analytics is a powerful tool that gives you access to a lot of actionable data that you can apply to develop your website. And when combined with other analytics, it’s really a must for growth.


